NLR, PLR, LMR and SII Explained
The Blood Test Ratios Your Doctor Isn't Checking — But Should Be
Your standard blood test contains powerful information about your immune system that almost nobody's looking at. While your doctor checks whether individual values fall within normal ranges, researchers have discovered that ratios between different blood cells reveal far more about your inflammatory state and immune function.
These markers — NLR, PLR, LMR, and SII — are linked to everything from cardiovascular disease risk to cancer outcomes. The research is robust, the calculations are simple, and yet these ratios are rarely discussed in standard medical care.
Let's change that.
What Are CBC Immune Ratios?
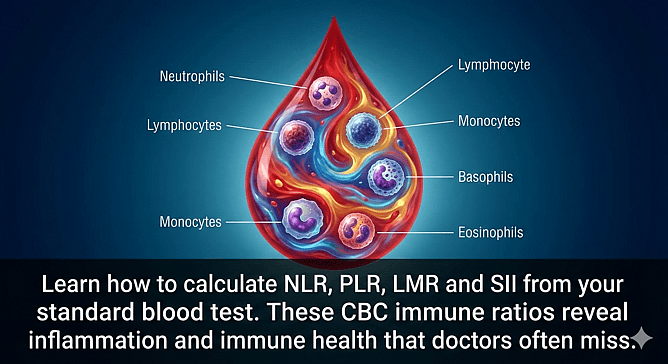
A Complete Blood Count (CBC) with differential measures various blood cell types, including white blood cells (neutrophils, lymphocytes, monocytes) and platelets. Traditionally, doctors assess whether each value falls within reference ranges.
However, the ratios between these cells tell a more nuanced story. They reflect the dynamic balance between different aspects of your immune system — innate versus adaptive immunity, inflammatory versus regulatory processes.
Four key ratios have emerged from the research, there are others but let's focus on the main ones.:
NLR — Neutrophil-to-Lymphocyte Ratio
Calculation: Absolute Neutrophil Count ÷ Absolute Lymphocyte Count
NLR reflects the balance between acute inflammation (neutrophils) and adaptive immunity (lymphocytes). It's the most extensively studied immune ratio.
A 2017 study in BMC Research Notes established that healthy adults have a mean NLR of approximately 1.65, with a normal range of 0.78 to 3.53. Values above 3.5 may indicate elevated systemic inflammation (1).
The research linking elevated NLR to poor health outcomes is remarkably consistent. A 2024 meta-analysis found that NLR predicts mortality in sepsis patients (2). Studies show elevated NLR correlates with cardiovascular disease risk, cancer progression, and reduced response to immunotherapy.
PLR — Platelet-to-Lymphocyte Ratio
Calculation: Platelet Count ÷ Absolute Lymphocyte Count
PLR combines platelet activity (which increases in inflammatory and prothrombotic states) with lymphocyte function. An elevated PLR signals enhanced inflammatory response and increased platelet activation.
A 2025 systematic review on intracranial haemorrhage found that elevated PLR was associated with poor functional outcomes and increased mortality (3). In cardiovascular disease, elevated PLR has been consistently linked to higher incidence of major adverse cardiac events (4).
LMR — Lymphocyte-to-Monocyte Ratio
Calculation: Absolute Lymphocyte Count ÷ Absolute Monocyte Count
Unlike NLR and PLR, a higher LMR is generally better. Lymphocytes provide adaptive immune responses, while monocytes, though essential, can support inflammation and tumour development.
A 2025 meta-analysis on acute myocardial infarction found that individuals with lower LMR had significantly elevated mortality rates (OR = 2.43) and increased incidence of major adverse cardiovascular events (5). In cancer, lower LMR has been consistently associated with poorer overall survival across multiple tumour types (6).
SII — Systemic Immune-Inflammation Index
Calculation: (Neutrophil Count × Platelet Count) ÷ Lymphocyte Count
SII is the most comprehensive ratio, incorporating three cell types to quantify the interaction between systemic inflammation and immune response. It was first proposed by Hu et al. in 2014 as a prognostic marker in hepatocellular carcinoma (7).
A 20-year cohort study following over 42,000 US adults found that elevated SII was an independent risk factor for both cardiovascular and all-cause mortality. Those in the highest quartile had a 29% increased risk of death (8).
In the original cancer research, SII was significantly associated with vascular invasion, larger tumours, and early recurrence in hepatocellular carcinoma patients (7).
Why These Ratios Matter They Detect Subclinical Inflammation
Standard reference ranges are designed to flag disease. If your neutrophils are dramatically elevated, you clearly have an infection. But what about chronic, low-grade inflammation that doesn't push individual values out of range?
Two people could have technically "normal" neutrophil and lymphocyte counts, yet one has an NLR of 2.0 while the other has an NLR of 3.5. That difference is meaningful — it reflects different inflammatory states that individual values miss.
This is why researchers call NLR a "biomarker of subclinical inflammation."
They Predict Real Health Outcomes
The prognostic value of these ratios spans nearly every major disease category:
Cardiovascular disease: High NLR and PLR predict heart attacks, strokes, and mortality
Cancer: These ratios predict tumour aggressiveness, treatment response, and survival
Kidney disease: Elevated SII predicts disease progression
Critical illness: Higher ratios correlate with increased ICU mortality
You Can Track Changes Over Time
Perhaps most powerfully, these ratios allow you to monitor whether your health interventions are working. Did your NLR improve after dietary changes? What happened to your SII during a stressful period?
A single snapshot might not tell you much, but trends over time reveal patterns about your immune and inflammatory status.
Optimal Ranges to Target
Based on current research, here are general targets for healthy adults:
Ratio Optimal Elevated (Investigate) NLR 1.0 – 2.5 Above 3.5 PLR Below 150 Above 200 LMR Above 3.0 Below 2.5 SII Below 400 Above 600
Important caveats: These aren't absolute cutoffs. Men tend to have slightly higher NLR than women. NLR naturally increases with age. Context matters — acute illness will temporarily elevate these markers, which is normal and appropriate.
The goal is understanding your personal baseline and tracking trends, not obsessing over exact numbers.
How to Get Your Ratios
Step 1: Request a CBC with differential from your GP. It's a routine, inexpensive test.
Step 2: From your results, note the absolute counts (not percentages) for neutrophils, lymphocytes, monocytes, and platelets.
Step 3: Calculate your ratios using the formulas above, or use free online calculators (MDCalc offers an NLR calculator).
Step 4: Record your values and track over time.
Strategies to Improve Your Immune Ratios
If your ratios are elevated, addressing the root causes of inflammation is key:
Diet: Anti-inflammatory eating patterns like the Mediterranean diet reduce inflammatory markers. Prioritise omega-3 fatty acids, colourful vegetables, extra virgin olive oil, and reduce processed foods.
Exercise: Regular moderate exercise has anti-inflammatory effects. Balance aerobic activity with resistance training, and ensure adequate recovery.
Sleep: Poor sleep drives inflammation. Prioritise 7–9 hours of quality sleep and address sleep disorders if present.
Stress Management: Chronic stress elevates inflammatory markers. Find what works for you — meditation, nature, social connection — and make it consistent.
Gut Health: With 70–80% of immune tissue residing in the gut, digestive health directly impacts these markers. Support your microbiome and address intestinal permeability if needed.
Targeted Supplementation: Certain compounds have demonstrated effects on immune modulation and inflammation:
Bovine colostrum supports lymphocyte function and contains anti-inflammatory immunoglobulins and lactoferrin
Carnosic acid (from rosemary) activates the NRF2 pathway while inhibiting inflammatory NF-kB signalling
Kawakawa (Piper excelsum) has demonstrated anti-inflammatory effects in recent research, with traditional use in rongoā Māori
IDP® (Immune Defense Proteins) is a patented complex of 50+ bioactive whey proteins extracted from New Zealand milk that work together to inhibit harmful pathogens and viruses, reduce inflammation, and support both the innate and adaptive immune systems.
The Bottom Line
Your standard blood test holds valuable immune information that's rarely utilised. By calculating NLR, PLR, LMR, and SII, you gain insight into your inflammatory status and immune balance — information that predicts real health outcomes.
These aren't exotic tests. They're simple calculations from routine blood work. Start tracking your ratios, implement evidence-based strategies to address inflammation, and monitor your progress over time.
Your immune system is working constantly to protect you. Understanding what it's telling you is the first step to supporting it properly.
Recently I developed an immune age calculator using these ratios but it is not yet available to the public as it has to go through regulatory clearance but I am excited and hopeful to offer this to those interested in slowing the aging of their immune systems and optimising wellness.
References
Forget P, et al. What is the normal value of the neutrophil-to-lymphocyte ratio? BMC Research Notes. 2017;10:12.
Wu H, et al. Predictive value of the neutrophil-to-lymphocyte ratio in the prognosis and risk of death for adult sepsis patients: a meta-analysis. Frontiers in Immunology. 2024;15:1336456.
Yuan X, et al. Role of the platelet-lymphocyte ratio as a prognostic indicator in patients with intracranial hemorrhage: a systematic review and meta-analysis. PLOS ONE. 2025;e0311153.
Azab B, et al. Neutrophil-lymphocyte ratio as a predictor of major adverse cardiac events among diabetic population: a 4-year follow-up study. Angiology. 2013;64(6):456–465.
Gu J, et al. Lymphocyte-to-Monocyte Ratio as a Prognostic Biomarker for Acute Myocardial Infarction: A Systematic Review and Meta-Analysis. International Journal of Clinical Practice. 2025;2025:5560827.
Gu L, et al. Prognostic role of lymphocyte to monocyte ratio for patients with cancer: evidence from a systematic review and meta-analysis. Oncotarget. 2016;7(22):31926–31942.
Hu B, et al. Systemic immune-inflammation index predicts prognosis of patients after curative resection for hepatocellular carcinoma. Clinical Cancer Research. 2014;20(23):6212–6222.
Xia Y, et al. Systemic Immune Inflammation Index (SII), System Inflammation Response Index (SIRI) and Risk of All-Cause Mortality and Cardiovascular Mortality: A 20-Year Follow-Up Cohort Study of 42,875 US Adults. Journal of Clinical Medicine. 2023;12(3):1128.